Relying on mainstream news is tricky. While it’s certainly important to keep yourself informed, you can’t always assume the information is objective. When news merges with entertainment, stories have a way of becoming sensationalized. And unfortunately for us, the realm of finance is no exception.
It’s up to us to dig deeper, especially whenever the media jumps to the conclusion that there might be a “market crash.” It’s a term thrown around quite a bit, but one that’s not always warranted. Nevertheless, it can quickly grab attention through the fear and shock it creates. We saw this happen this past January, so let’s take a closer look together.
What Happened During The Most Recent Market Correction?
When we examine a market correction we often use market indexes as tools of measurement. A market index is simply a tracker of the highs and lows of a given group of stocks or assets. You’ve likely heard of some like the S&P 500 or NASDAQ, but there’s also ones you may be unfamiliar with like the Russell 2000.
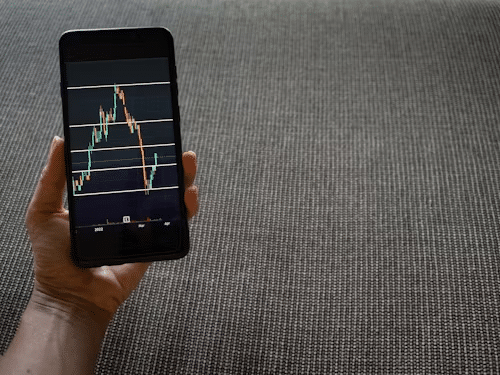
Well, this past January, several of these market indexes took a noticeable dip in value. Below is an overview of the performance of some of the major U.S. market indexes between January, 4th and 27th of this year:
- S&P 500: The Standard & Poor’s 500 is a collection of 500 major, publicly traded stocks on U.S. exchanges. Think ones like Apple, Microsoft, Coke, and Google. This index fell 9.7%.1
- DJIA: The Dow Jones Industrial Average is made up of 30 major companies across various industries. Some of these include: Caterpillar, Home Depot, Disney, and Nike. This index fell 7.1%.2
- Russell 2000: The Russell 2000 is a collection of 2,000 stocks considered to be “small-cap” due to their lower overall market capitalization. This index fell 14.8%.3
These are certainly noteworthy drops. But it’s important to look back on history to help keep things in perspective. For instance, small-cap securities represented by the Russell 2000 index have often been prone to more volatility. And when compared to other “market crashes” in the past, the bigger indexes have seen far worse times.
What Were The Drivers Of The January Correction?
We tend to feel fearful when encountering things we don’t fully understand. But by simply getting more information, we can start to reduce our feelings of anxiety. So let’s take a deeper look at the forces at play in this correction:
- Inflation: This past December consumer prices inflated 7%, which is the highest annual increase since 1982.6 And high inflation often means drops in stock prices. That’s because it causes increases in borrowing and input costs (ex: labor and materials), and decreases in living standards and expectations for earnings growth.7
- Interest Rates: In response to the high inflation, the Federal Reserve has projected it will raise interest rates three times this year. Talks of higher interest rates makes the lower fixed rates of bonds less attractive, and can spook investors into sell offs. In this case, the anxiety-fueled selling of bonds also spilled over into stocks.6
- Omicron: News of the Omicron variant scared investors, and fueled more panic selling of stocks. During 2020 and 2021, the S&P 500 did quite well and earned 16% and 27% respectively. But Omicron shattered the hope of things going back to “normal,” and spurred investors to cash in before things could get worse.8
- Supply Chain Problems: Last year supply chain issues rocked the economy, and we covered its effects on real estate and remodeling. Now in 2022, issues with labor, cargo ships, and supply and demand patterns are still persisting. And according to the Wall Street Journal, 45% of economists think we won’t see improvement until the second half of 2022.9
Believe it or not, there’s a silver lining in all this. We’re able to see it’s not just one thing that drives market trends. Rather it’s the interaction of multiple forces like investor attitudes, current events, the supply chain, and governmental policy. And when this storm passes, these same forces will have the capacity to bring economic prosperity.
How Does This Correction Look In The Context Of History?
Taking the time to consider how difficult others have had it can help keep our complaining in check. It’s not that we shouldn’t see the problems we face presently as troublesome. Rather, it just helps us keep a healthy perspective on the severity of what’s at hand. Consider the index drops from some of these true market crashes of the past:
- Black Monday: On October 19, 1987, the DJIA plummeted almost 22% in one day. The notorious drop then triggered a global market decline, and in a matter of weeks, caused the majority of other major exchanges to drop over 20% in value.4
- Dot-Com Bubble: Between 1995 and 2000, there was a surge in price for revolutionary (at the time) internet-based securities. As a result, the tech-heavy NASDAQ Composite Index skyrocketed over 400%. But in 2001, the bubble burst and it lost 76.81% of its value by October, 2002. The index took almost 15 years to recover.5
- Great Recession: In September, 2008 we saw a crash brought on by a debt-fueled housing, banking, and labor crisis. For the DJIA the crash continued into 2009, and hit rock bottom with 54% loss in value. It then took a full four years for the index to recover.5
- Coronavirus Crash: While facing the initial quarantines, shutdowns, and policy changes of the pandemic, the market took a big hit. In the last week of February, 2020, the S&P 500 and DJIA dropped 12% and 11% respectively. The DJIA had further drops of 9.99%, and 12.9% in March, 2020. But the market wholly recovered by May, 2020.5
I reviewed the above instances to show what “true” crashes have looked like in the past. You’ll also want to check out what just happened to cryptos too. But don’t take this to mean that the dips we’re seeing now aren’t significant, they are. It’s just that jumping to the term “market crash” may be uncalled for, especially when you consider ones of the past.
What’s Happening Now'
Now that we’ve taken a look at historic crashes, let’s see how things have been moving recently. Again we’ll look at the indexes to inform us on what’s happened since the stock prices dropped in January. This time we’ll be looking at what’s happened between January, 27th and February 7th, of this year:
- S&P 500: This index bounced back 3.6% by February 7th (this past Monday), which is a drop of only 6.6% from its January 4th level.1
- DJIA: This index bounced back 2.7% by February 7th (this past Monday), which is a drop of only 4.7% from its January 4th level.2
- Russell 2000: This index bounced back 4.1% by February 7th (this past Monday), which is a drop of only 11.9% from its January 4th level.3
These past few weeks have shed a much needed light on the most recent drop in stock prices. In just a few weeks, the situation has taken a noticeable turn for the better. And overall, the market swing we’re looking at doesn’t seem to be calling for all hands on deck.
What Could Happen And What Should You Do?
The truth of the matter is that we simply don’t know what the market will do. We can speculate, look at past trends, and forecast our best educated guesses, but we’re still left with much to be desired. That being said, there are some concrete things we can always bank on.
First off, we can always count on volatility being present. Corrections are par for the course, crashes are not, and the term is thrown out to scare people. must be expected. Secondly, we can also place our faith in recovery. While the timeframe may vary, we’ve yet to face a crash we weren’t able to overcome.
Thirdly, we know our media outlets have a way of overblowing situations in the quest for ratings. Granted, the most recent hiccup certainly showed noticeable dips across major market indexes. However, we’ve already seen noticeable recovery, and when compared to true crashes in the past, this one may end up being more of a blip.
Market dips can cause anyone a bit of uneasiness. But if you approach them in the right way, you may be able to take advantage of their low entry points and have faith in a full recovery.
If you’d like to talk to a professional about what’s going on, or have any other of your questions answered, reach out to us at 650-336-0598. You can also fill out a contact card here, and we’ll reach back out to you.


